The turbine of an automotive turbocharger is subject to a wide and demanding range of requirements and constraints. High efficiency is required to reduce the pumping work of the engine that can make a small but desirable improvement in fuel economy. The automotive application also requires a good transient response, and a low rotating inertia of the turbine is necessary for this. Durability and the ability to operate for a guaranteed lifetime are required – but such performance is not easy to achieve, given the hot gas environment and the way the turbine is subject to frequent changes in condition. The market is very competitive, and so manufacturing cost is very important. These various factors are in competition with each other, and a successful turbine is one that achieves the right balance between them, rather than one that excels in one particular area.
In the small sizes of turbocharger required in the automotive sector, radial-inflow turbines are very commonly used. In order to limit the blade stresses, the blades are constructed from radial sections. The radial section construction makes for a particularly simple blade geometry that can be easily cast, but which has important limitations. Acting in combination with the radial-inflow geometry, the inlet blade angle is constrained to be in the radial direction; i.e., zero degrees measured from the radial. No sweeping of the blade in either direction is possible, and the optimum incidence requirement must be achieved by the correct matching of the stator to the rotor. In effect, this imposes a particular reaction on the turbine design and eliminates reaction as a design variable.
Another feature that is peculiar to turbocharger turbines is the highly pulsating nature of the exhaust gas flow from the engine, which is controlled by the exhaust valve events. A typical blowdown pulse means that the pressure at the turbine inlet instantaneously achieves a high value very soon after exhaust valve opening, and then decreases to a much lower value as the cylinder empties, until another exhaust valve opening causes it to rapidly increase again (Figure 1a). Since the power developed by the turbine is a strong function of pressure ratio, this means that most of the available exhaust energy occurs during a limited range of the engine cycle and corresponds to a high turbine pressure ratio.
This is best understood in terms of blade speed ratio, U/C0, where U is the turbine blade tip speed and C0 is an isentropic expansion velocity that is a function of the turbine pressure ratio. The efficiency characteristic of a turbine is very nearly a single curve when plotted against U/C0. During the engine cycle, the inertia of the rotating assembly of the turbocharger keeps the blade tip speed almost constant, and so U/C0 varies inversely with the turbine pressure ratio. Soon after exhaust valve opening (point B in Figure 1), the turbine pressure ratio is high and U/C0 is low, and as the cylinder empties, the pressure ratio falls, U/C0 increases, and the operation moves towards point A.
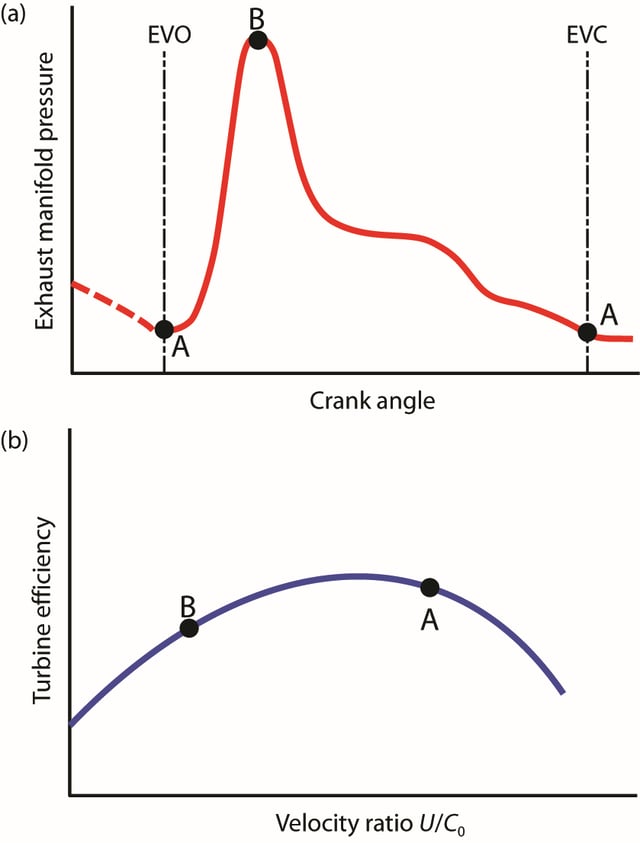
Figure 1. Exhaust manifold pressure and power available during the engine cycle, and its effect on turbine performance
It follows from this that, to make best use of the available exhaust energy, the turbine should have a high efficiency at low U/C0. However for a conventional radial-inflow turbine, the peak efficiency occurs at U/C0 @ 0.7, but point B in Figure 1b typically occurs at values of about 0.3–0.4.
Given the constraints under which the turbine must be designed and operate, it is generally recognised that little more conventional development and efficiency improvement of the radial turbine is possible, and increasingly attention has turned towards ways to capture more of the exhaust gas energy. The argument above shows that this requires a turbine that has improved efficiency at low U/C0.
To date, most numerical optimization in turbocharger design has been focused on relatively conventional problems of developing existing designs. However it might also be used more creatively to investigate new design concepts and particularly to address the multiplicity of problems and limitations that affect the turbine, as described above.
In setting up the multi-disciplinary optimization (MDO), we applied only the bare minimum of constraints to the solution. The turbine was not necessarily radial-inflow and not limited to radial blade sections. In order to target low manufacturing cost of the turbine, the turbine blade design was constrained to ruled elements. Beyond that, the optimizer was set free to explore the design space.
The test case was chosen to be a turbine for a passenger car turbocharger, which represents perhaps the most challenging application for turbocharger turbines – due to the need for the right balance between steady-state performance (requiring turbocharger efficiency) and transient performance (inertia), as well as its wide-ranging drive cycle (durability), size, and cost.
Two operating conditions were defined - a full load condition where the engine is running at maximum speed and power, and a part load condition.These two conditions are listed in Table 1.
Maximum stress occurs at the full load condition and must be maintained at a value lower than the strength of the rotor material at the operating temperature. Fatigue failure is handled in a simple but commonly-used way of specifying that the first blade flapping frequency should be at least a defined multiple of the rotation frequency. The turbine is nozzleless, so only a once-per-revolution excitation need be considered.
Table 1. Turbine design and operational targets
|
Operating Point
|
Part Load
|
Full Load
|
|
Power [kW]
|
Maximise
|
20
|
|
Total-to-static pressure ratio
|
1.5
|
2.35
|
|
Mass flow rate [kg/s]
|
|
0.135
|
|
Rotor speed [rev/min]
|
96322
|
208340
|
|
Rotor stress [MPa]
|
|
< 500
|
|
Blade first flapping frequency
|
|
> 4.4 ´ rotation frequency
|
|
Polar inertia of the rotor
|
Minimise
|
No specific target for moment of inertia is made, in spite of the importance of this parameter. The reason is that the inertia cannot be judged in isolation from the rest of the powertrain, because the actual determining factor is the transient response of the engine. It was recognised that the result of this test case would not be a unique turbine design, but a possible range of turbines of different inertias and presumably different efficiencies also.
Each cycle of the MDO executes three tasks in sequence:
- Set the flow path and rotor geometry, and evaluate the aero performance using CFD at full load
- Reset the rotational speed and boundary conditions, and evaluate the aero performance at part load
- Run mechanical (FE) analysis, using the full load conditions and CFD results
In the turbine model, the volute was replaced with a dummy nozzle in the form of a set of vanes that define the rotor inlet conditions. This was done in order to exclude volute from optimization and to reduce 3D CFD run time, yet retain possibility to control velocity triangles at rotor inlet.
The MDO statistics are listed in Table 2. The optimization software used was TurboOPT II™[1] from Concepts NREC. The optimization engine was IOSO PM™[2], and the turbine geometry was developed in AxCent®[3], the CFD was Pushbutton CFD3, and the FEA was Pushbutton FEA™[4].
Table 2. Optimizer statistics
- Optimization problem metrics
- 49 inputs
- Nozzle, rotor flowpath, blade angles
- Rotor thickness, hub theta offset at LE
- Rotor axial length delta
- 18 controlled/dependent parameters, controlled by inputs
- Auto-size rotor exit duct
- 39 constraints
- Radial variations of hub and tip contour control points constrained between inlet and exit radii
- Full load, part load, and FEA operating requirements
- Feasible and convergence CFD and FEA criteria
- 3 objectives
- Maximize mass flow at full load to meet design required value (important) and exceed a specified minimum required power level
- Maximize power at part load (most important)
- Minimize polar inertia of the rotor (important)
- CFD and FEA
- CFD: 505K nodes, 2500 iterations, ~1.5 hrs per run
- FEA: ~50K nodes; ~ 10 min per run (thermal, stress, frequency)
- Optimizer
- ~7500 geometries evaluated
- 9 Pareto-optimal solutions
- ~3.5 hr per cycle of 2 CFD + 1 FEA runs
- ~60 days on 18, 4-core CPU nodes (72 cores total)
* A 2-week run would require 78 CPU w/4 cores
The results shown here are primarily Pareto curves, based on a set of chosen solutions that give the maximum calculated efficiency for each inertia value. It is found from the obtained optimized results that the minimum inertia is controlled by the power requirement at full load, and the maximum inertia is controlled by the stiffness requirement of the rotor.
Curves of efficiency at full load and part load are shown in Figure 2. Both exhibit a clear rising trend in efficiency with inertia.
The need to develop a certain power output at full load means that lower inertias are unacceptable because of falling efficiency. The fixed nature of turbine characteristics means that the efficiencies at full and part load increase together, as is evident in the cross plot in Figure 3.

Figure 2. Pareto curves showing limiting values of efficiency with rotor inertia for (a) full load and (b) part load conditions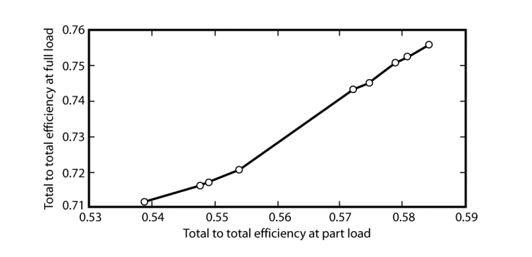
Figure 3. Cross plot of efficiency at full load and part load
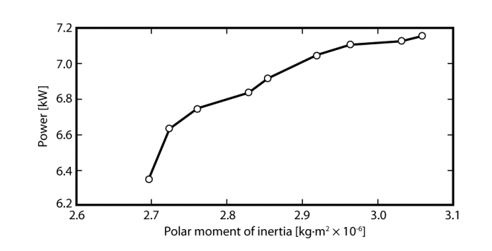
Figure 4. Turbine power output at part load condition
The effect of increasing part load efficiency is to increase the power at this condition (Figure 4), and for the transient response of the engine the increase in turbine power (and therefore boost pressure and engine power output) must be balanced against the increase in turbine inertia (and therefore response of the turbocharger).
The mechanical limits for the turbine are the peak blade stress and the ratio of the first blade flapping frequency to rotation excitation frequency, and for the Pareto points, these results are plotted in Figure 5. The graph of maximum stress shows that there are solutions in the middle of the inertia range that are considerably below the limit. This suggests that there may be potentially more highly stressed but still acceptable geometries that might be further investigated if this portion of the range proved to be of interest. The graph of frequency ratio demonstrates that the high inertia solutions are limited by this parameter, and in fact this sets the upper limit to the Pareto curve, whereas the low inertia solutions allow some margin in stiffness and are limited by stress.
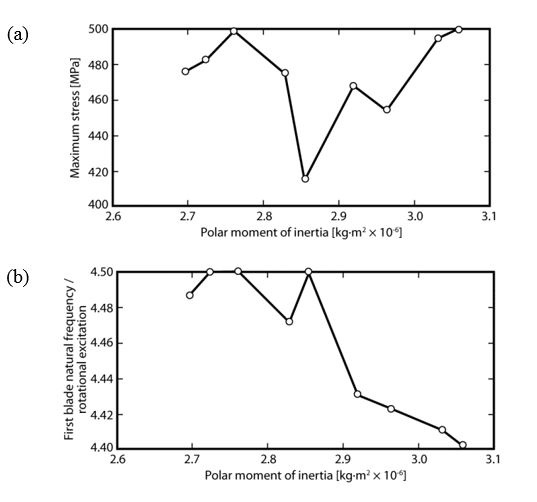
Figure 5. Maximum rotor stress and ratio of first blade flapping frequency to rotational excitation frequency on the Pareto curve
The solutions represented in the Pareto curves are from different turbine geometries, but all of them follow a very similar shape of the flow path contours that is illustrated in Figure 6. The objective of minimising inertia is strongly reflected in this geometry, and is accomplished primarily by reduced inlet radius and axial length. It is interesting that the optimization results do not support a pure axial turbine that has a small part in automotive turbocharging.
For the range of results described, the inlet hub and tip radii are plotted in Figure 7. The blade is also leaned at inlet, as can be seen from the wrap angle at the hub (the angle at the tip was held constant, so the hub wrap angle is a measure of the inlet lean). The lean angle is greater for smaller inertia and smaller blade height. The flow angle at inlet to the rotor, set in the optimization by the dummy nozzle blades, was almost constant across the range of Pareto cases, which follows from the requirement that all of the turbine solutions have the same flow capacity. The rotor reaction at full load was approximately 0.7, and at part load was 0.5, with a general trend of a slight increase in reaction with reducing inertia.
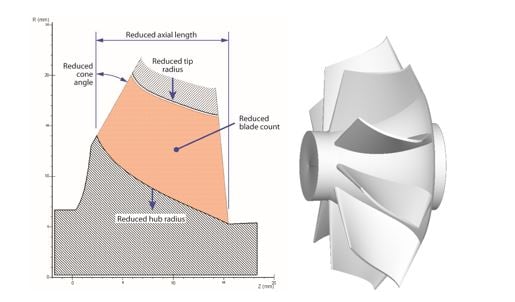
Figure 6. Optimized rotor geometry
To put these results in context, a conventional radial turbine for this application, designed with the same constraints, has a tip radius of about 23 mm and an inertia of about 10-5 kg×m2, as compared with 20 mm radius and inertias in the range of 2.7-3.1 ´ 10-6 kg×m2 for the optimized turbine. The efficiency of the radial turbine at full load is predicted to be 75% and at part load, 57%. These are very similar to the efficiencies shown in Fig. 3 for the optimized turbine.
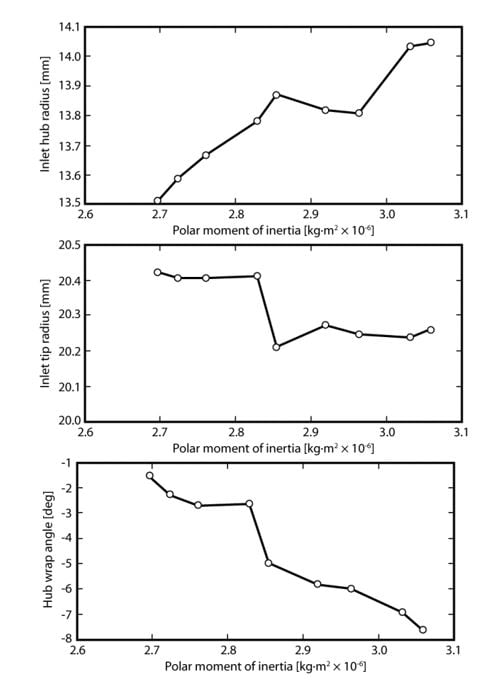
Figure 7. Variation of inlet hub and tip radii and inlet wrap angle at the hub along the Pareto curve
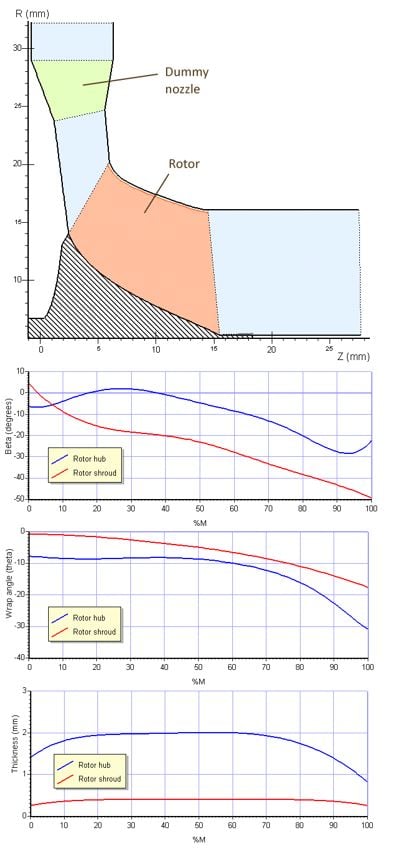
Figure 8. Rotor geometry, showing flow path and streamwise variations of blade angle, blade lean, and thickness
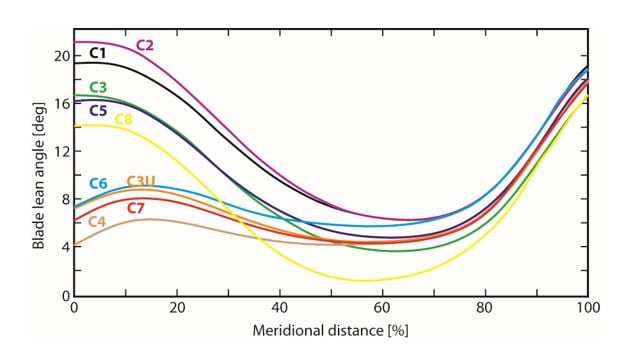
Figure 9. Variation of blade lean angle with meridional distance. C1 – C8 denote various solutions along the Pareto curve
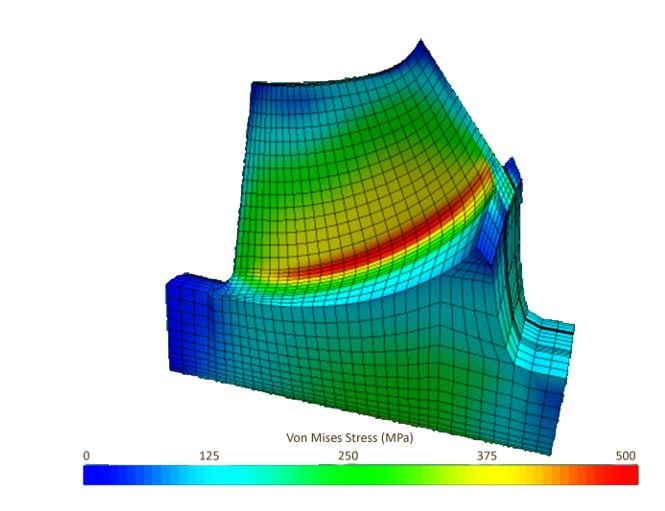
Figure 10. Stress distribution in rotor blade and hub. Maximum stress occurs at the hub of the blade and is below the defined material strength limit
A representative sample of rotor geometries along the Pareto curve is shown in Figure 8, showing the meridional flow path and stream-wise variations in blade angle and blade thickness at hub and tip. These do not vary greatly for the set of results forming the Pareto curve. The blade lean angle shows the greatest variation and has the largest impact on the results. The lean angle at inlet varies between about 4°–21° (the tip is moved in the direction of rotation, relative to the hub), but nearer the exit the various solutions converge and the range at exit is 16°–19° (Figure 9), that still deliver stresses below the material limit of 500 MPa (Figure 10).
Numerical MDO has proved to be an effective technique in the design of an automotive turbocharger turbine that is subject to conflicting targets of performance and inertia, and is also subject to limitations of strength, rigidity, and economic manufacturing.
This project has demonstrated a second and important aspect of numerical optimization, arriving at a solution that would not be expected in extrapolating from conventional design approaches and relying on past experience.
[1] TurboOPT II is a trademark of Concepts NREC, LLC
[2] IOSO PM is a trademark of Sigma Technology, CJSC
[3]AxCent and Pushbutton CFD are registered trademarks of Concepts NREC, LLC
[4]Pushbutton FEA is a trademark of Concepts NREC, LLC