Why Meanline Scripting is Becoming Essential for Turbomachinery Design
Manual meanline design can sometimes feel less like design and more like managing a chain of tiny decisions.


This post is about one of the most useful design tools for rotordynamics of turbomachinery: The Undamped Critical Speed Map. A critical speed map can provide a great deal of insight on the potential behavior of a rotor-bearing system without requiring a lot of model detail.
Let’s explore how the CSM can be a helpful design tool by using the DyRoBeS software. Our simple example model will consist of a shaft, one bearing near each end of the shaft, and three disks mounted near the center of the shaft.

Figure 1: DyRoBeS Model
At this point, the only details that we need for the bearings are bore diameters and locations of the bearing centerlines. We don’t need to be concerned about the bearing design details, or even what type of bearings are used. Furthermore, we can neglect the influence of forces at seals, impellers, etc.
The undamped critical speed map is essentially a parametric study of how the undamped critical speeds of a rotor-bearing system will change as a function of bearing stiffness. For our example system, let’s assume that the bearings have relatively low stiffness; 10,000 lb/in. The figures below show the frequencies and mode shapes associated with the first three critical speeds:
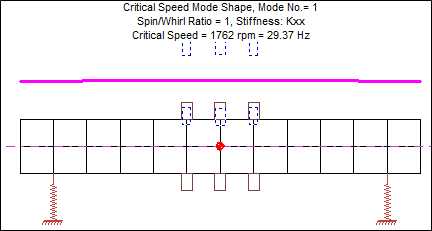
Figure 2: 1st Critical Speed, Kxx=Kyy=10,000 lb/in
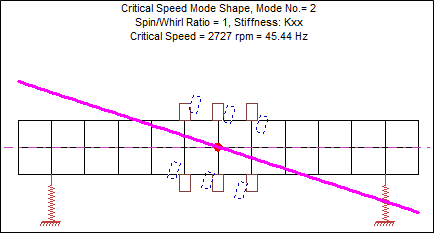
Figure 3: 2nd Critical Speed, Kxx=Kyy=10,000 lb/in
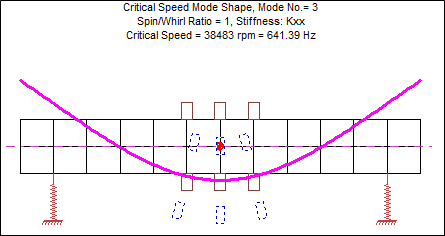
Figure 4: 3rd Critical Speed, Kxx=Kyy=10,000 lb/in
Looking at the mode shapes for the first two critical speeds, we can see that the shaft is moving as a (nearly) rigid body. For these two critical speeds, almost all of the deflection is taking place at the bearings. For the third critical speed, the shaft is taking on a bent shape. What if the bearings were made stiffer? Let’s re-generate the critical speed mode shapes using bearing stiffness of 500,000 lb/in.
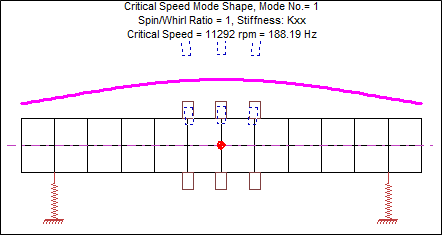
Figure 5: 1st Critical Speed, Kxx=Kyy=500,000 lb/in
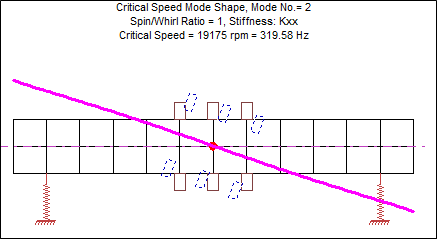
Figure 6: 2nd Critical Speed, Kxx=Kyy=500,000 lb/in
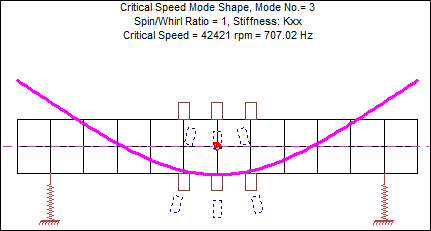
Figure 7: 3rd Critical Speed, Kxx=Kyy=500,000 lb/in
With this increased bearing stiffness, the first critical speed has increased by a factor of 6.4 (from 1,762 rpm to 11,292 rpm), the second critical speed has increased by a factor of 7 (from 2,727 rpm to 19,175 rpm). By comparison, the third critical has changed very little (38,483 rpm to 42,421 rpm). When a critical speed map is generated, we can see how the critical speeds change over a wide range of bearing stiffness.

Figure 8: Critical Speed Map
On the critical speed map, the black dots correspond to the first example (Kxx=Kyy=10,000 lb/in) and the blue dots correspond to the second example (Kxx=Kyy=500,000 lb/in). Because the first two critical speeds have significant deflection at the bearing locations, they appear on the CSM as sloped lines. The steepness of the slopes tell us that a modest change in bearing stiffness may have a significant influence on these two critical speeds. However, the third critical speed appears on the CSM as a horizontal line. This indicates that major changes in bearing stiffness will have little influence on the critical speed. When the bearing stiffness becomes very high, all three of these critical speeds appear as horizontal lines on the CSM.
For our example, suppose that we know the machine needs to operate continuously over a speed range of 8,000 rpm to 12,000 rpm. We can overlay this speed range on the CSM by using horizontal dotted lines.
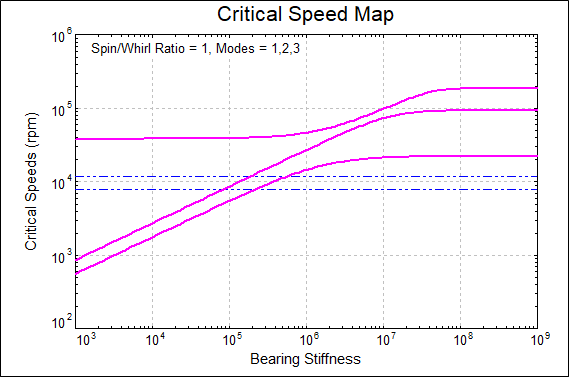
Figure 9: Critical Speed Map with Operating Speed Lines
This CSM shows that if the actual bearing stiffness is below about 75,000 lb/in, then the first two critical speeds will be below the continuous operating speed, and the machine would only have to pass through them as it accelerates up to the operating range. If the bearing stiffness were roughly 200,000 lb/in then the first critical speed would be at the low end of the continuous operating range, and the second critical speed would be at the high end.
It is worth mentioning that this simple analysis does not include the important effects of damping, or any mention of how the critical speeds may actually be excited during operation. However, the bottom line is that an undamped critical speed map can give valuable insight during the early stages of a rotordynamics analysis.
We welcome your questions and comments here, or contact us at info@conceptsnrec.com for further dialogue.
Tags: CAE Software, Engineering
Manual meanline design can sometimes feel less like design and more like managing a chain of tiny decisions.

For most turbomachinery engineers, optimization isn’t a new idea. It’s a critical part of their workflow that can’t be overlooked. But sometimes that crucial step isn’t easy to get to.
It’s no secret that turbomachinery design has been one of the most demanding CAE environments, thanks to tight tolerances, complex physics, and long design cycles. That hasn’t changed in 2026, but...