Why Meanline Scripting is Becoming Essential for Turbomachinery Design
Manual meanline design can sometimes feel less like design and more like managing a chain of tiny decisions.


Beyond being a fun tongue twister, visualizing the velocity vectors is probably the most useful and intuitive information available in turbomachinery design. Many fundamental parameters can be gleaned directly from these triangles. These include: flow coefficient, work coefficient, stage reaction, de Haller number, diffusion factor, and diffusion ratio, to name just a few. A great many design rules are predicated on these parameters in the initial design process, which is generally geared to target velocities as the starting point, rather than a predetermined geometry.
There is no shortage of conventions used to plot velocity triangles, but they all involve a triangle formed by three vectors. These vectors are the absolute velocity (often denoted as “C”) and the relative velocity (often denoted as “W”) and local wheel speed resulting from the rotation (often denoted by “U”).
The figure below shows two common methods of displaying velocity triangles. The diagram on the left is probably the most intuitive display. The designer can tell at a glance what the flow looks like relative to the geometry. As such, there’s immediate feedback on the incidence and deviation angles in the design. The display on the right is a bit more esoteric, but very useful for visualizing the flow and work coefficient. The velocity is normalized by the local value of U, and in this case, an axial example, they are the same. When plotted this way, the horizontal distance between the peaks of the triangles is equivalent to the work coefficient (defined as dH/U^2) and the vertical height of the peaks is the flow coefficient (defined as Wm/U, Wm the axial or meridional velocity). The reaction of the stage is defined as the pressure split between the rotor and stator and, in this particular example, the value is 0.5 and the triangles are symmetrical. The flow coefficient, work coefficient, and reaction are three of the most fundamental qualities in axial compressor and axial turbine design, and all three can be visualized at a glance with this method.

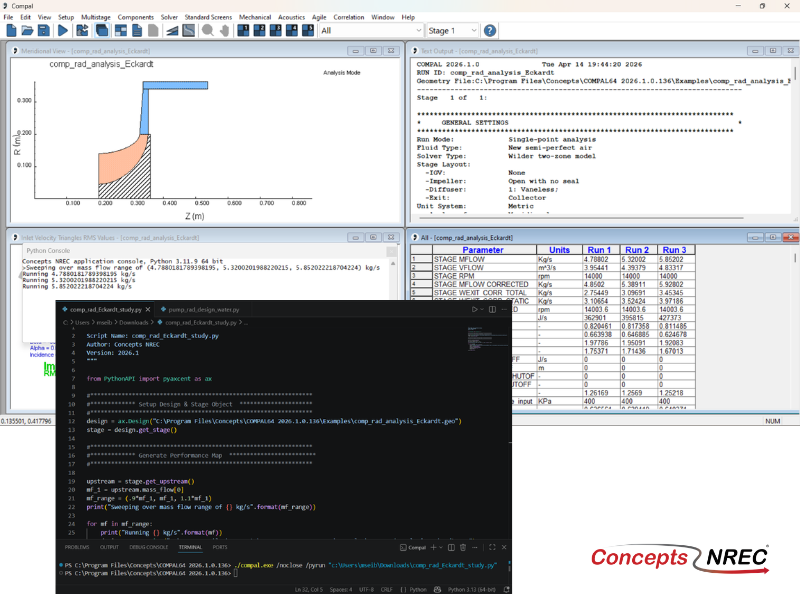
For a radial machine, the triangles can be a bit more complex, due to the fact that the local wheel speed is not constant. The first figure, below, is from Concept NREC’s COMPAL® program. The left section shows the inlet vectors. A careful look will show that there are actually three triangles corresponding to the hub, mean, and tip radius locations. The exit vectors also show three triangles, but in this case, they represent the primary, secondary, and mixed out flow states at the impeller exit. The second figure below shows a vector diagram displayed in the same manner as the figure above this paragraph, but this method is used less frequently for radial design.


Velocity vectors are probably the most useful information the designer can get from an analysis. A quick look at the velocity triangles gives immediate insight on the nature of the flow field in the machine. For this reason, it’s important to examine the velocity triangles early in the design process, before proceeding to the next steps. A simple sanity check can save you a lot of time and effort later on.
Tags: CAE Software
Manual meanline design can sometimes feel less like design and more like managing a chain of tiny decisions.

For most turbomachinery engineers, optimization isn’t a new idea. It’s a critical part of their workflow that can’t be overlooked. But sometimes that crucial step isn’t easy to get to.
It’s no secret that turbomachinery design has been one of the most demanding CAE environments, thanks to tight tolerances, complex physics, and long design cycles. That hasn’t changed in 2026, but...