Why Meanline Scripting is Becoming Essential for Turbomachinery Design
Manual meanline design can sometimes feel less like design and more like managing a chain of tiny decisions.


As one might expect, the temperature of a substance typically increases as energy is added to it. This is the case with most substances in all phases. The exception is when a substance crosses to a different phase, which usually involves no temperature change. The energy difference between these phases is called the “energy of formation”.
Leaving the phase change aside, if we focus on the thermodynamics of a substance in the gas phase alone, we find the temperature versus energy curve often looks something like this.
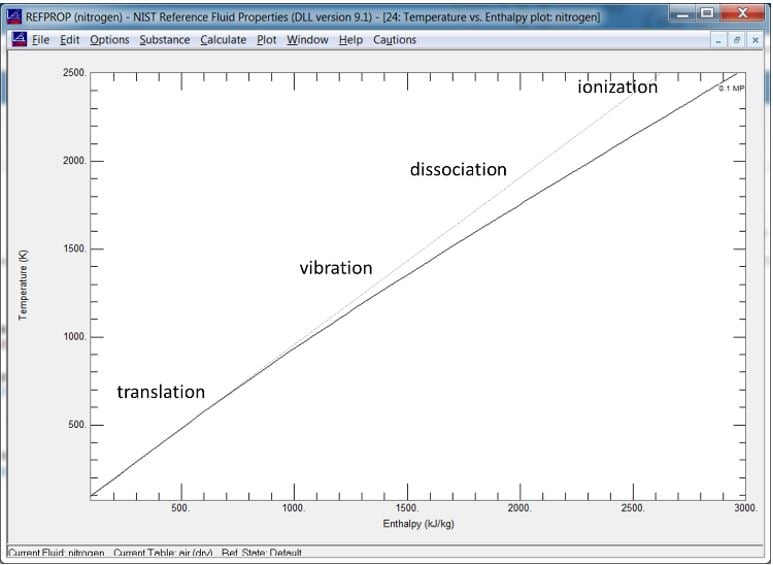
Figure of Temperature vs. Enthalpy for Nitrogen as Calculated by NIST Refprop
In the first section of the plot, we see the temperature of the gas increases fairly linearly as energy is added in. Here the energy level is quantified by the enthalpy, a useful overall measure of energy level. In this initial region, most of the energy is in the form of translational energy (movement of the molecules) and this is realized directly as temperature. Once the temperature increases beyond a certain point, other effects begin to grow. The first is vibration of the molecules. Next is dissociation of the molecules where the chemical bonds are broken and absorb energy. Lastly, comes ionization, which further absorbs energy at the atomic level. We can see the net effect of these is to the depress rate of temperature rise as energy levels increase.
If we invert the curve and plot temperature versus energy, we get something like this:
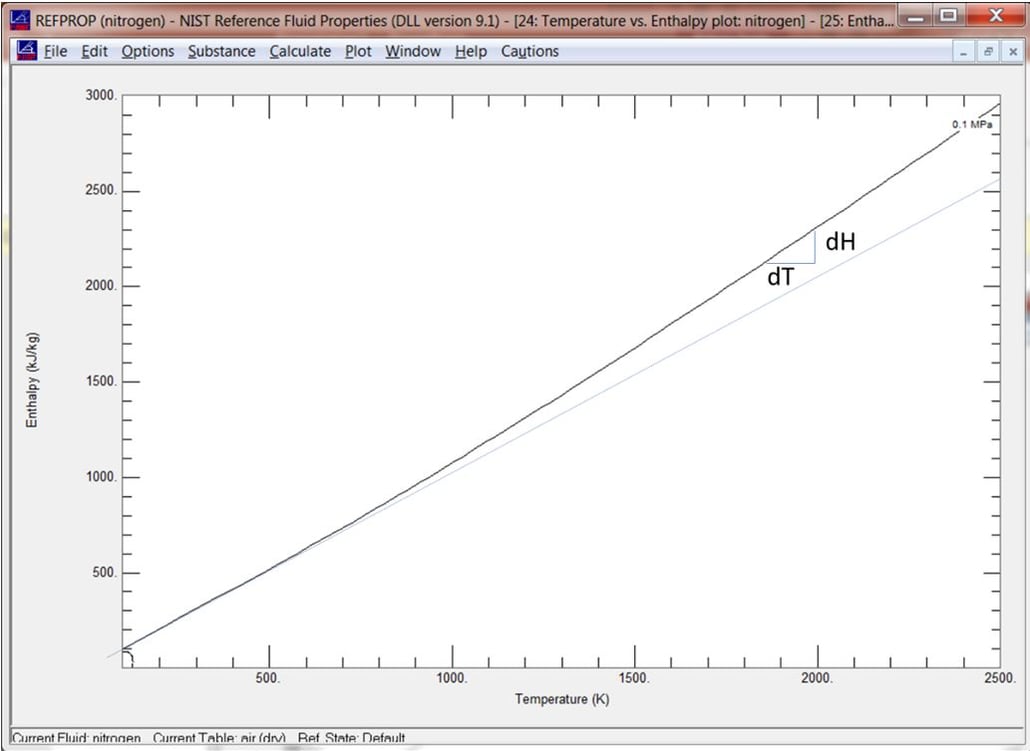
Figure of Enthalpy vs. Temperature For Nitrogen as Calculated by NIST Refprop
Note the slope of the curve is the change in energy level (dH) with respect to temperature (dT). This is referred to as the specific heat (Cp) and it can clearly change over the range of temperature. Some thermodynamic models capture this effect, and some do not. A perfect gas model (blue line) assumes a linear relationship which, by extension, assumes moderate temperatures. A semiperfect gas model uses empirical data for Cp in the model. A common curve for Cp looks something like this for nitrogen:
%20verses%20temperature%20vs%20for%20nitrogen%20as%20calculated%20by%20NIST%20Refprop.jpg?width=1025&name=Figure%20of%20specific%20heat%20(Cp)%20verses%20temperature%20vs%20for%20nitrogen%20as%20calculated%20by%20NIST%20Refprop.jpg)
Figure of Specific Heat (Cp) vs. Temperature for Nitrogen as Calculated by NIST Refprop
Note the increasing value of Cp with increasing temperature. I’ll talk more about modeling approaches to capture this effect in another blog.
Blogs in this series:
Fluid Phenomena Primer: Energy Versus Temperature, Specific Heat
Phase Change - Make Mine a Double!
When Perfect is Good Enough - Perfect Gas Models
What's Better than Perfect? Semi-Perfect Gas Models
Going Through a Phase – Modeling Phase Change with Cubics
Tags: CAE Software, Engineering, thermodynamics
Manual meanline design can sometimes feel less like design and more like managing a chain of tiny decisions.

For most turbomachinery engineers, optimization isn’t a new idea. It’s a critical part of their workflow that can’t be overlooked. But sometimes that crucial step isn’t easy to get to.
It’s no secret that turbomachinery design has been one of the most demanding CAE environments, thanks to tight tolerances, complex physics, and long design cycles. That hasn’t changed in 2026, but...